
Operations Secrets to Spotting Pipeline Bottlenecks Instantly
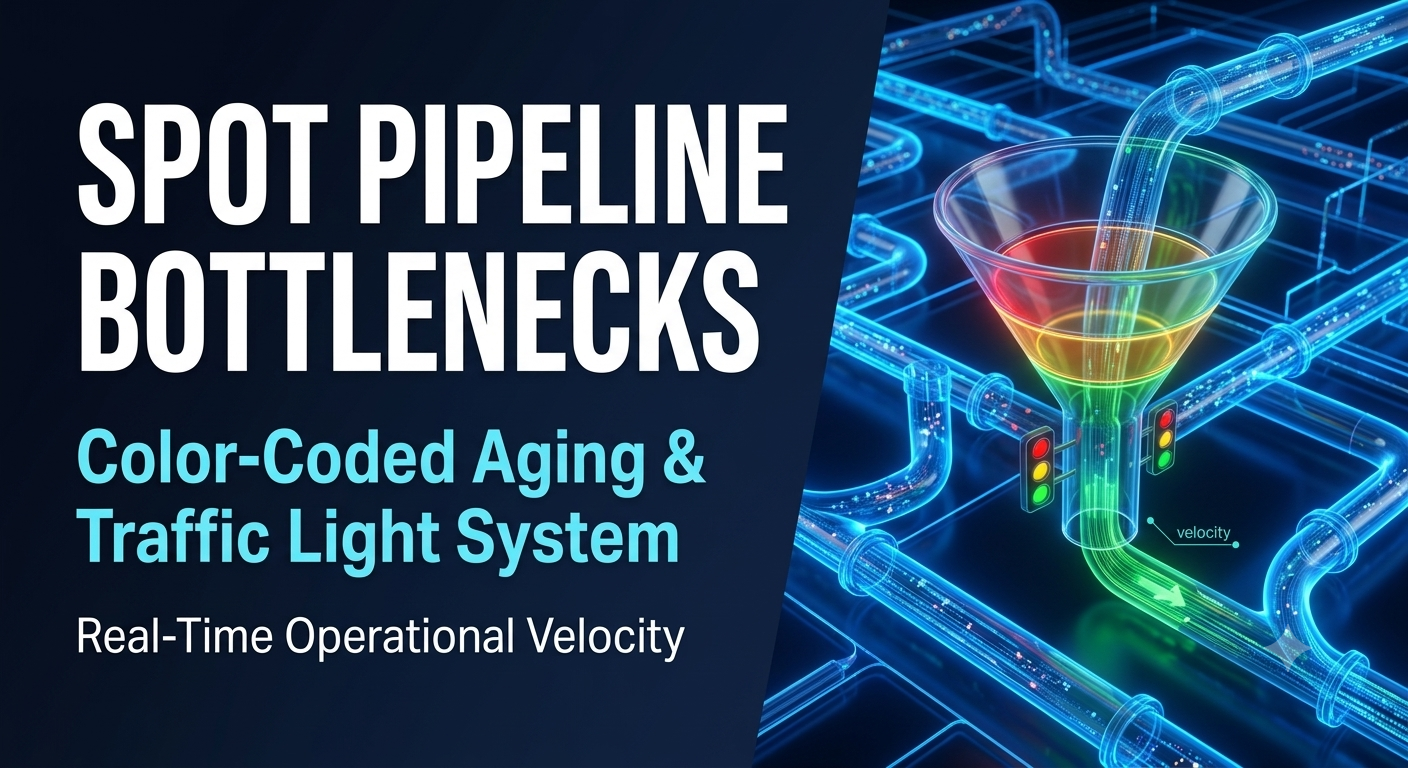
Revenue collapse never happens overnight. It is almost always the cumulative result of dozens of microscopic operational failures that go unnoticed for weeks inside your pipeline.
A star candidate sits at the “Hiring Manager Review” stage for 14 days until a competitor snatches them up. A $50,000 enterprise proposal lies untouched in a sales rep’s inbox awaiting legal approval. A high-priority client onboarding project stalls quietly because nobody followed up on a missing access credential.
In modern operations—whether in Revenue Operations (RevOps), Sales, Recruitment, or Project Management—the primary obstacle is rarely a lack of data. Modern teams are swimming in data. Instead, leaders suffer from a condition known as being Data-Rich, Insight-Poor.
When your team relies on traditional static reports, end-of-month reviews, or black-and-white spreadsheets containing hundreds of rows, spotting operational delays is like searching for a needle in a haystack. By the time the monthly report highlights a missed revenue target, the damage was done weeks ago.
To protect your bottom line and accelerate throughput, you must transform your management style from reactive reporting to proactive operational steering. The secret lies in Visualizing the Funnel—converting raw spreadsheet entries into a dynamic, color-coded early warning dashboard that reveals pipeline bottlenecks in under three seconds.
1. The Anatomy of a Bottleneck: Where Pipelines Fail
Before you can build an early-warning tracking system, you must understand what a bottleneck actually is and why traditional management practices fail to catch them.
In operational theory, a bottleneck is any stage in a process where work accumulates faster than it can be processed. Bottlenecks act as operational dams, restricting the downstream flow of revenue, talent, or project deliverables.
The Anatomy of Workflow Friction
- 1. High-Volume Input: Deals and prospects flow smoothly into the top of the funnel.
- 2. The Operational Bottleneck: Work accumulates at a single restricted stage (e.g., Legal Review sitting at a 14-day average stagnation).
- 3. Constricted Revenue Output: Deals trickle out to closing at a fraction of your actual team capacity.
Why Do Bottlenecks Form?
Bottlenecks are rarely caused by employee laziness. They are structural failures caused by three main factors:
- Unclear Ownership (The Hand-off Trap): When a deal moves from Sales to Legal, or a candidate moves from Talent Acquisition to the Department Head, ownership becomes fuzzy. If neither party explicitly owns the clock, the task drops into an operational black hole.
- Capacity Misalignment: A sales team might excel at generating qualified leads, but if your solutions engineering team only has two specialists to run technical demos, every deal will grind to a halt at the demo stage.
- Undefined SLAs (Service Level Agreements): Without strict internal operational guidelines stating how long a task is permitted to stay in a given stage, team members naturally prioritize urgent firefighting over aging pipeline items.
The Three Silent Warning Signs of Pipeline Decay
Operational leaders must monitor three specific indicators to spot trouble before it impacts quarterly results:
1. Volume Stagnation
A sudden, abnormal concentration of work items piling up at a single phase. For example, if 60% of all active deals in your sales pipeline are crammed into “Contract Review,” your legal pipeline is officially broken.
2. Pipeline Aging Spikes (Time-in-Stage)
Pipeline Aging measures the exact number of days a deal or task has remained in its current stage without moving forward. An aging spike occurs when the average duration of a task exceeds its historical baseline (e.g., jumping from a 2-day average to 9 days).
3. Drop-Off Rate Anomalies
A sharp, unexplained drop in conversion rates between two consecutive stages. If 80% of prospects move smoothly from “Discovery” to “Proposal,” but only 10% move from “Proposal” to “Negotiation,” your proposal process contains a major friction point.
2. The Reporting Trap: Lagging vs. Leading Indicators
The fundamental flaw in traditional business management is a heavy reliance on Lagging Indicators.
🔴 Traditional Reporting (Lagging Focus)
- Focus Area: Monthly Revenue Totals, Churn Rates, and Quarterly Misses.
- Operational Mindset: Autopsy after the failure has already occurred.
- Management Style: Reactive firefighting when it is too late to rescue the account.
🟢 Dynamic Visual Management (Leading Focus)
- Focus Area: Pipeline Aging Days, Stage Stagnation Alerts, and Real-Time Hand-off Blockers.
- Operational Mindset: Early warning intervention before the deal expires.
- Management Style: Proactive rescue that keeps deals moving forward smoothly.
A Lagging Indicator tells you what has already happened. While lagging indicators are essential for financial accounting, they are completely useless for operational prevention. Analyzing a lagging indicator is like conducting a post-mortem autopsy—it tells you why the patient died, but it cannot save the patient’s life.
Conversely, a Leading Indicator predicts future performance based on current operational health. Pipeline Aging is the ultimate leading indicator. If your deals are aging 50% longer in the negotiation stage this week, your monthly revenue target three weeks from now is already compromised.
3. Building a Visual Pipeline Matrix on Your Spreadsheet
You do not need to invest tens of thousands of dollars in overly complex Business Intelligence (BI) software to achieve operational visibility. In fact, most heavy software suites fail because they are too cumbersome for managers to configure on the fly.
You can transform standard spreadsheets (like Google Sheets or Excel) into a high-visibility, real-time command center by applying three core operational rules.
Rule 1: Standardize and Define Unambiguous Pipeline Stages
The most common operational mistake is using vague, subjectively defined stage names. Replace vague labels with Action-Oriented Milestones:
- ❌ Vague Label: In Progress ➔ 🟢 Actionable Stage: Technical Demo Scheduled
- ❌ Vague Label: Negotiating ➔ 🟢 Actionable Stage: Redlines Sent to Buyer
- ❌ Vague Label: Recruiting ➔ 🟢 Actionable Stage: Stage 2 Technical Assessment
Limiting your pipeline to 5 to 7 clearly defined, chronological stages ensures that every team member shares an identical understanding of what moving a deal forward actually entails.
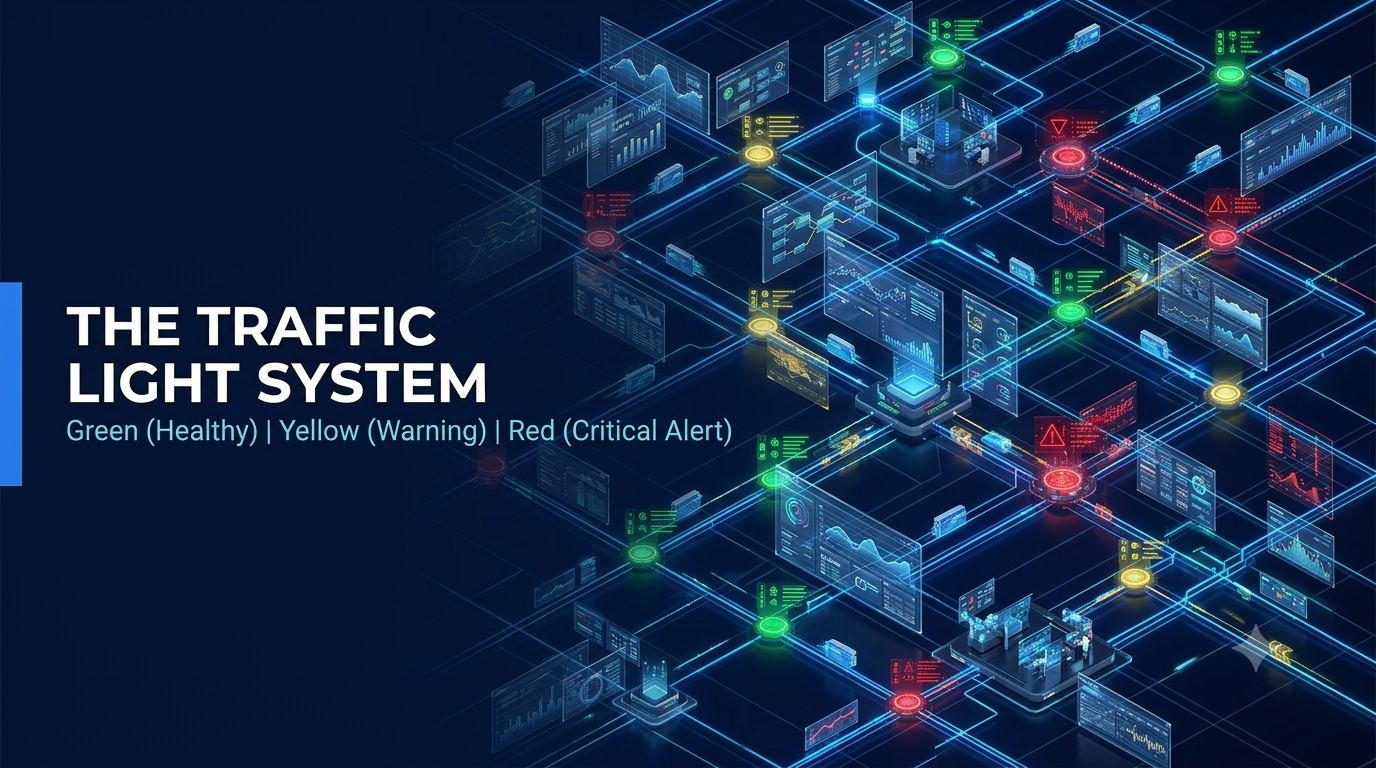
Rule 2: Apply the “Traffic Light” Conditional Formatting Rule
Human cognition processes visual cues up to 60,000 times faster than text. Establish a universal Traffic Light Color Scheme based on task aging:
- 🟢 GREEN (Normal Velocity): In stage for less than 3 days. Task is moving within healthy operational limits. No manager intervention required.
- 🟡 YELLOW (Warning Threshold): Stagnant for 4 to 7 days. Velocity is slowing down. Requires review during weekly check-ins.
- 🔴 RED (Critical Alert): Stuck for more than 7 days. Deal is in immediate danger of dying from inertia. Action required: Manager must step in immediately to clear the blocker.
When a manager opens a visual pipeline matrix built this way, they do not read individual rows. They simply scan for clusters of RED cells. If a column is filled with red markers, a bottleneck has been identified in under three seconds.
Rule 3: Implement Dynamic Slicers and Views
To make your visual matrix operational during daily standups, configure dynamic controls (Slicers or Filter Views) to isolate trouble spots instantly:
- Filter by Assignee: Instantly evaluate whether a specific team member is overloaded or holding back a high concentration of aging tasks.
- Filter by Pipeline Aging: Hide all Green items and display only Yellow and Red alerts to run hyper-focused, 15-minute operational rescue meetings.
- Filter by Deal Value / Priority: Sort your aging alerts by financial impact so managers allocate their intervention time to high-value opportunities first.
4. Comparative Analysis: Static Spreadsheets vs. Visual Funnel Systems
❌ Approach A: Traditional Static Spreadsheets
- Data Representation: Plain black-and-white rows and static raw text.
- Bottleneck Detection Method: Manual reading of individual rows and line-by-line calculations.
- Review Frequency: Weekly or monthly scheduled reporting meetings.
- Management Style: Reactive firefighting after deals are lost or deadlines are missed.
- Operational Velocity: Slow; delays go unnoticed for days or weeks.
🟢 Approach B: Visual Pipeline Management System
- Data Representation: Color-coded aging markers, visual heat maps, and standardized statuses.
- Bottleneck Detection Method: Instant visual recognition of red clusters in under 3 seconds.
- Review Frequency: Continuous real-time monitoring and daily micro-standups.
- Management Style: Proactive rescue and removal of blockers before tasks fail.
- Operational Velocity: Fast; immediate escalation when tasks pass threshold limits.
5. Practical Use Cases Across Core Operations
Visual funnel management is not restricted to sales. It applies to any operational environment that relies on a multi-stage workflow.
Use Case 1: B2B Sales Pipeline Management
- The Problem: Sales reps consistently miss quarterly quotas despite generating a high volume of discovery calls.
- The Visual Reveal: Applying aging rules reveals that 45% of high-value deals turn RED at the “Custom Proposal” stage, spending an average of 12 days there.
- The Operational Fix: Management deploys standardized proposal templates and an automated quote generator, cutting stage duration from 12 days to 2 days and restoring pipeline velocity.
Use Case 2: Talent Acquisition and Hiring Pipelines
- The Problem: A fast-growing tech startup keeps losing top engineering talent to competing offers.
- The Visual Reveal: The pipeline matrix shows a massive cluster of RED candidate cards at the “Take-Home Technical Assessment” review phase.
- The Operational Fix: The Head of Operations establishes a dedicated, rotating engineering review shift with a strict 48-hour grading SLA, preventing candidate drop-off.
Use Case 3: Client Onboarding and Project Operations
- The Problem: Customer churn spikes within the first 90 days after contract signing due to delayed project launches.
- The Visual Reveal: The spreadsheet highlights a persistent YELLOW/RED bottleneck at “Client Security Credential Provisioning.”
- The Operational Fix: The team creates a self-service client onboarding portal that collects security requirements before kickoff, cutting onboarding time by 50%.
6. The 4-Step Playbook to Deploy Visual Management This Week
🗓️ Phase 1: Audit and Standardize Pipeline Stages (Days 1 & 2)
Sit down with key team leads and review your current workflow stages. Remove any stage label open to interpretation. Ensure every stage represents an objective, verifiable milestone with a clear owner.
🗓️ Phase 2: Establish SLAs and Aging Thresholds (Day 3)
Define how many days a task should reasonably take to pass through each stage:
- Stage 1 (Discovery): SLA = 2 Days
- Stage 2 (Solution Demo): SLA = 4 Days
- Stage 3 (Legal & Compliance Review): SLA = 5 Days
Set your rules so that passing the SLA turns the cell YELLOW, and exceeding double the SLA turns it RED.
🗓️ Phase 3: Configure Your Spreadsheet Interface (Day 4)
Apply conditional formatting rules across your pipeline sheet. Add dynamic slicers for team members, deal size, and aging status so red alerts stand out instantly upon opening the sheet.
🗓️ Phase 4: Institute the 15-Minute Daily “Red Run” (Day 5 & Beyond)
Stop asking reps for general updates on every account. Instead, open your visual dashboard during standups and discuss ONLY the Red and Yellow items. Ask: Why is this item stuck? What obstacle can management remove today to get it back to Green?
7. Frequently Asked Questions (FAQs)
- What is the difference between a pipeline bottleneck and normal process time? Normal process time is the expected, healthy duration required to complete a task (e.g., taking 2 days to draft a contract). A bottleneck occurs when tasks stall beyond that healthy baseline due to capacity constraints or operational inefficiencies.
- Can I build a visual pipeline matrix using standard tools like Google Sheets or Excel? Yes! Built-in spreadsheet features like Conditional Formatting, Data Validation, and Slicers allow you to create a dynamic, color-coded visual tracking dashboard within hours.
- How do I prevent team members from manually altering dates to hide aging tasks? In spreadsheets, use simple scripts that automatically record a timestamp whenever a task stage drop-down is changed. In CRM tools, lock historical timestamp fields so stage duration is calculated automatically by the system.
- What should a manager do when a bottleneck is identified? Identifying a bottleneck is only the first step. Once a red cluster is spotted, the manager must actively assist in removing the operational friction—whether that means reallocating team capacity, simplifying requirements, or negotiating directly with stakeholders.
Visual Clarity Drives Operational Velocity
Management philosopher Joseph Juran famously noted that “What gets measured, gets managed.” In modern, fast-paced operations, we must take that principle one step further: “What gets visualized, gets fixed.”
By standardizing your pipeline stages, establishing clear aging rules, and color-coding your workflow metrics, you convert your administrative sheets into an early-warning system. Stop reacting to lost deals and missed deadlines—visualize your funnel today, eliminate your bottlenecks in real time, and protect your revenue engine.